3.1
INTRODUCTION
Methodology is the usage of simplified methods or techniques for achieving the formulated objectives. In this chapter the stages involved in the study with the flow chart is given in fig 3.1. Various data required for the study and the process involved in the collection are also discussed. The development of web based accident analysis system is explained as separate in chapter 4.
3.2
METHODOLOGY
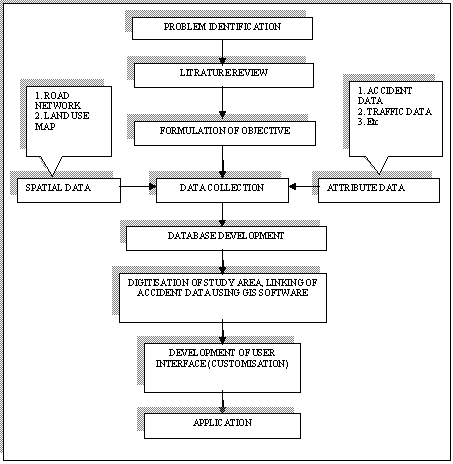
Fig 3.1. Methodology Flow Chart
In a system, information from the traffic accident investigation report forms is directly encoded via an interface program. The application shall be constructed under client/server architecture. Reporting police stations shall only need to forward their reports to the concerned office for proper processing and input. The system shall also update the master database at the central site.
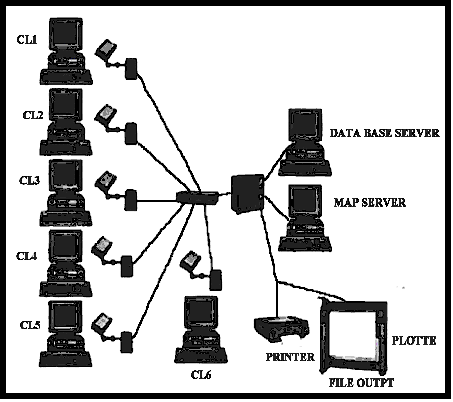
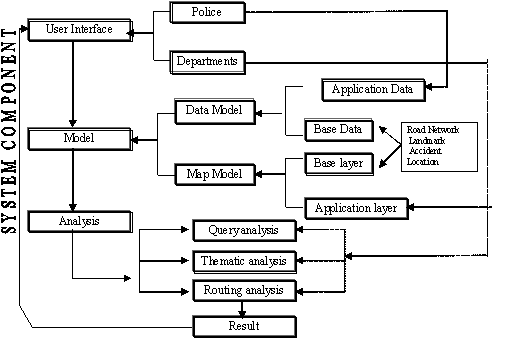
Fig 3.3 System Component flow Chart
Spatial
data has to be linked to accident data to provide the graphical interface to
search for accident frequencies with varying spatial units, such as
intersections and highway segments. To reduce accident frequencies, it is
imperative to investigate the contributing factors at a disaggregated level
3.1
STUDY AREA
The
area for application of developed system is an Adyar Taluk (Urban area) and
3.3.1 Adyar
The Adyar area is in southern part of the Chennai which is snow in Fig3.4 and Fig 3.5 shows detailed road network of Adyar Taluk map. Latitude extends from 12.98 to 13. 03 and Longitude extends from 80.22 to 80.28. Total Area covers approximately 46 Sq. km and total length of the road in Adyar Taluk choosen for the study is 211.507 km.
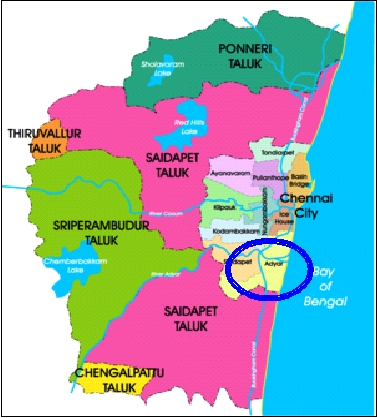
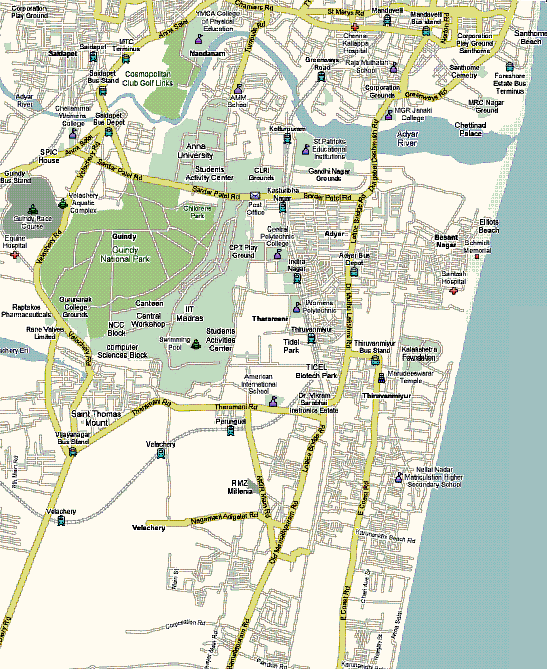
Fig 3.5 Detailed road network map of Adyar Taluk
Major Roads in Adyar |
Number of accident |
|
|
58 |
|
Cannal |
15 |
|
|
73 |
|
|
115 |
|
LB Road |
155 |
|
MGR Road |
22 |
|
Old |
16 |
|
|
200 |
|
|
117 |
|
Thiruvalluvar Salai |
131 |
|
Total Accident |
902 |
3.3.2
The
3.4.1 COLLECTION OF ACCIDENT
DATA
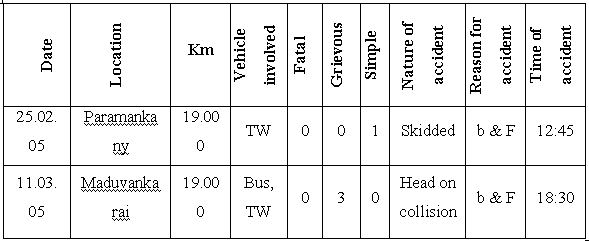
Accident data for Adyar area was collected from DGP Office and East Cost Road Data from TNRDC for the year 2004 to 2006. A Sample of data collected is shown in table 3.2.
Table.3.2 Sample Data Format
3.4.2 COLLECTION OF PRIMARY DATA
Latitude and Longitude for each accident location was collected and database was prepared. Other data like Hospital location, important landmark in the study area were collected and used in preparation of thematic map.
Table 3.3 Name of
Hospital in Adyar Taluk
|
SI
no |
NAME |
|
1 |
|
|
2 |
PM Hospital |
|
3 |
TTK De-addiction center |
|
4 |
|
|
5 |
|
|
6 |
|
|
7 |
PM Hospital |
|
8 |
|
|
9 |
|
3.4 PRESENTATION OF DATA
3.5.1 ADYAR
Accident data for Adyar Taluk was collected from DGP office and presented below. Fig 3.7 shows accident trend in Adyar Taluk. Fig 3.8 type of accident Adyer Thaluk. Accidents occurrence in 2005 declined when compare to 2004. In 2006 there was marginal increase.
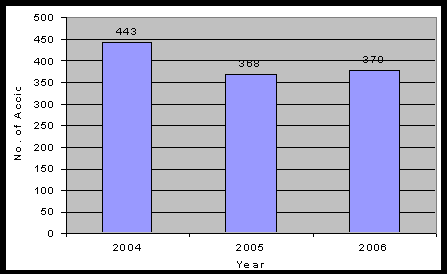
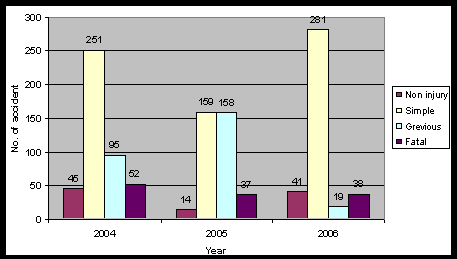
Fig 3.8 Type of Accident existing in Adyar
The
people between the ages 18-35 were involved in more number of accidents. Fig
3.9-Show age wise accident involvement in Adyar Taluk.
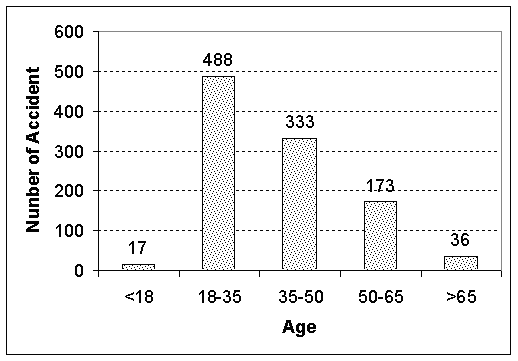
Fig .3.9. Age wise accident Involvement in Adyar Taluk
|
CHICLE |
2004 |
2005 |
2006 |
|
M/C
|
168 |
146 |
136 |
|
CAR |
138 |
110 |
130 |
|
PEDESTRIAN |
96 |
105 |
107 |
|
VAN |
58 |
34 |
31 |
|
AUTO |
55 |
46 |
46 |
|
LORRY |
46 |
26 |
22 |
|
CYCLE |
42 |
42 |
29 |
|
FIXED OBJECT |
40 |
16 |
24 |
|
BUS |
33 |
28 |
47 |
|
SELF FALL |
13 |
15 |
6 |
Source: DGP office
Fig 3.10 shows the classification of accident in terms of vehicle involved, which shows the Two wheeler and Car are involved in max number of accidents. Pedestrian involved was also found to be high.
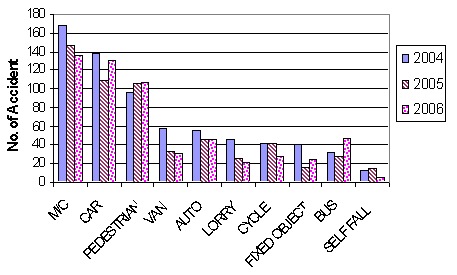
Fig3.10 Vehicle wise accident involvement Adyar Taluk 2004-2006
Accident data for ECR was collected from TNRDC. The Accident data are analysed and Inference are derived based on the following factors.
- Trend of Accident for the past 3 years
- Trend of Accidents with respect to Month wise data
- Trend of Fatal Accidents with respect to Month
- Trend of Fatal Accidents with respect to Chainage
- Trend of Total Accidents with respect to Time
-
Trend of Fatal Accidents with respect to Time
Table 3.5
|
Major Towns & Villages |
Chainage |
|
Thiruvanmiyur* Injambakkam* Uthandi Muthukadu Kovalam Mamallapuram* Pudupatinam* Koovathur Mugaiyur Marakkanam* |
11 / 800 18 / 900 24 / 200 30 / 000 35 / 000 53 / 500 72 / 000 77 / 000 83 / 500 117 / 000 137 / 000 |
Source – TNRDC
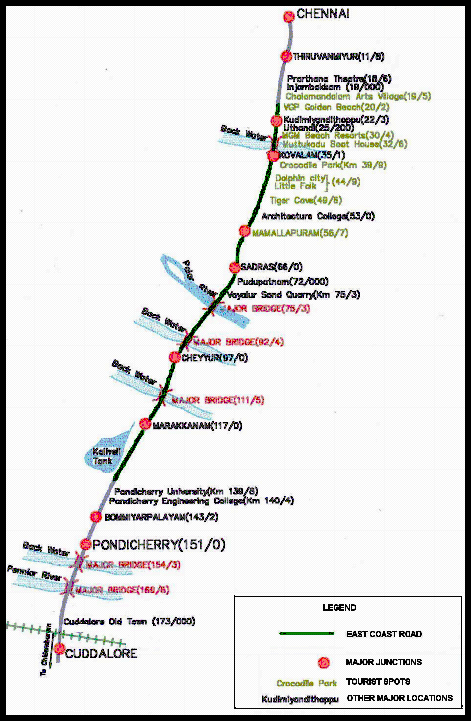
Of the above towns, Mamallapuram and Marakkanam have bypasses already constructed as a part of the ECR Project. The ECR stretch has several tourist attraction centers including Amusement parks, Boat clubs, Centre for Herpetology, Beach resorts etc.,. The details of the Centers are given below.
Table 3.6 Tourist
spots along ECR Between Chennai & Cuddalore
|
Location |
Chainage |
Type of Attractive centers |
|
MGM Dizzee World, Muthukadu Boat House, Muthukadu Crocodile Farm, Vadanamedi Dolphin city Tiger cave Mamallapuram |
20 / 200 30 / 200 32 / 600 35 / 100 39 / 800 44 / 800 49 / 600 53 / 500 150 / 000 |
Beach resort Amusement park Boating Beach resort Centre for Herpetology Amusement park Beach Beach resort Beach resort |
Source: TNRDC
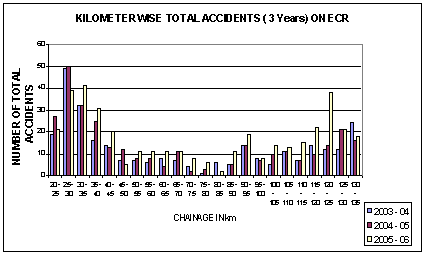
Fig 3.11 Accident
Trend on
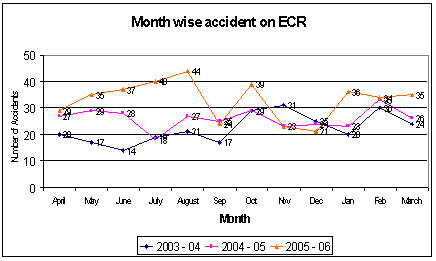
Fig3.12 Month wise Accident occurrence on
Fig
3.12 shows month wise accident occurrence on
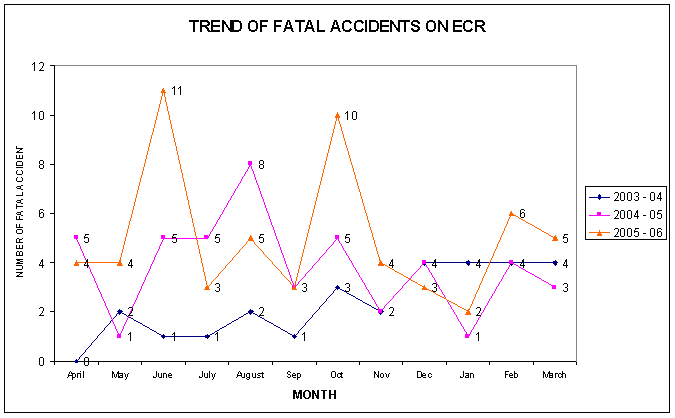
Fig3.13 Month wise
Fatal Accident occurrence on
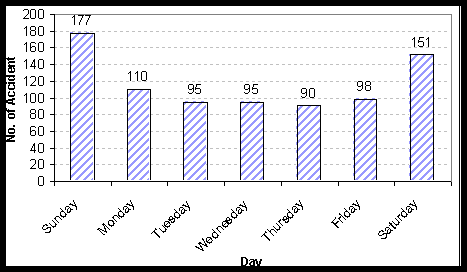
Fig3.14 Day wise Accident occurrence on
Fig3.14 shows
day wise accident occurrence on
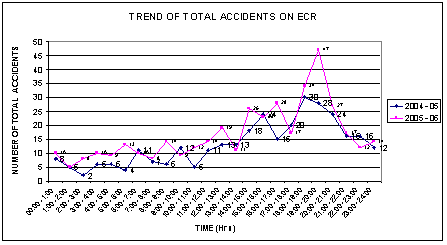
Fig
3.15 shows time wise accident occurrence on

Fig3.16 Time wise Fatal Accident occurrence on East Cost Road
3.6 DIGITISATION OF ROAD NETWORK AND PREPARATION OF THE DATA BASE
3.6.1 DIGITISING THE MAP
Thematic map are prepared using MapInfo and Arcview3.2a software. Thematic map are spatial date, which will be in any one of the form of spatial entities like point, Line or polygon. All the thematic maps are in Lat/1Long as a coordinate system and WGS84 as a reference datum. The thematic maps are
Ø Road Network map
Ø Accident Location Map
Ø Hospital Location Map
Ø Important Landmark Map
MapInfo software used to digitize Road Network map for Adyar and East Cost. Thematic map for accident locations, Landmark Location, Hospital Location are Created using Latitude and Longitude collected in primary data.
Topology is important parameter, which establishes the relationship between the spatial entities. Topology is created using Arcgis9.1 software fig3.16 shows the Road network map with accident location for Adyar Taluk.
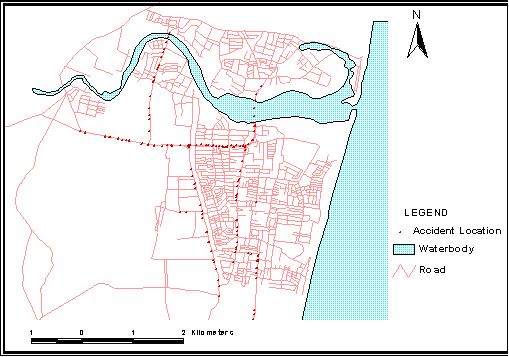
Fig 3.17.Road Network
map with Accident location
3.6.2 PREPARATION OF DATABASE
The ability of GIS software is linking spatial data with its attributes and performing the analysis based on the attribute date. It is easily understandable when the attributes are represented with its spatial Databases are prepared for each thematic map.
Ø Road network database contains attributes like ID, Latitude, longitude, From Node, To Node, One Way, and Length for each segment.
Ø Accident database contains consist attributes like ID, Latitude, longitude, Date of accident, Day, Month ,Year, Time, Type of vehicle involved,Type of accident, Number of accident, Number of people involved, Reasons for accident, Landuse at the accident location, Nearest landmark.
Ø Hospital database contains consist of name of hospital and coordinate of the location.
Ø Landmark database contains contain name of the landmark and its latitude and longitude.